
Top may be the most common tool in use whenever a preformance issue is hit. It is simple, quick and dumb. Besides the heavy metal stuffs like perf and gprof, another really useful and simple tool is getdelays, which provides the latency statistics per process/task for CPU, memory, and I/O.
1. Where to get it
https://www.kernel.org/doc/Documentation/accounting/getdelays.c
As mentioned in the comment, need to compile it with:
gcc -I/usr/src/linux/include getdelays.c -o getdelays
Since it uses the netlink socket, it requires root permission to run as well.
2. What it does
Getdelays does a simple job – creating a netlink socket, sending a request to the kernel for reading the task statistics, and printing out the reply. Essentially, this netlink socket exposes the kernel taskstats structure to the user space. For more information about taskstats struct, please refer to
https://lxr.missinglinkelectronics.com/linux/include/uapi/linux/taskstats.h#L177
3. How it looks like
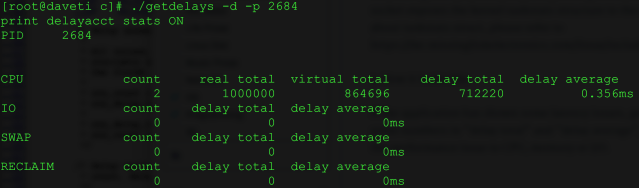
In the example above, it shows the delay information for httpd, which seems working fine without any memory or I/O issues, except some minor delays from CPU since it is a background process rather than an interactive shell. If the application has shown some latency issues, getdelays should be able to show some numbers in “delay total” and “delay average”, which should be helpful to limit the scope of the performance issue to CPU, memory or I/O.
4. Note
Cannot expect too much from getdelays, which simply prints some counts in the kernel, and should be enough to know where the problem would be. To find the performance bottleneck, strace/ltrace/dtrace/lttng/perf/gprof should be considered as the next step.